The “Dashboard” menu summarizes transaction data in graphical and list formats. Only specific User Profiles, including Owner, Administrator, Manager, and Supervisor, are granted access to this feature. It allows data segmentation per selected categories, both in number and sales volume, and selection of different types of graphical representation.

Filter Data
The “Dashboard” feature enables the filtering of data for default time periods of “24 hours”, “7 days”, or “14 days”, and also allows for the visualization of transaction data, which can be displayed as totalized amount (“Total”) or aggregated into categories such as “Channels”, “Terminals”, “Systems”, and “Methods”.
The advanced search option allows you to select up to 10 stores and one or more Terminals per Store to refine your search results.
“Channels” filter
Shows the volume and count of transactions per day. The system shows only the 7 most popular types used for transaction processing. All other are aggregated into Other. The data can be split based on the channel:
- Digital – eCommerce and/or
- Physical – POS terminal (available only in some of the markets)
“Terminals” filter
This category covers the payments equipment or interface. Examples:
- POS: traditional Point-of-Sales (POS) terminal;
- WEB: e-commerce terminal;
- mPOS: mobile payment terminal.
Every terminal that does not fall in the classification indicated above, is considered in the category of “Others”.
“Systems” filter
Systems are the international brands responsible for the credit card schemes (e.g.: Visa, Mastercard).
The “Systems” option displays a maximum of seven financial products, sorted by “volume” or “count” (depending on the tab which is being viewed) and the remaining are categorised under “Others”.
“Methods” filter
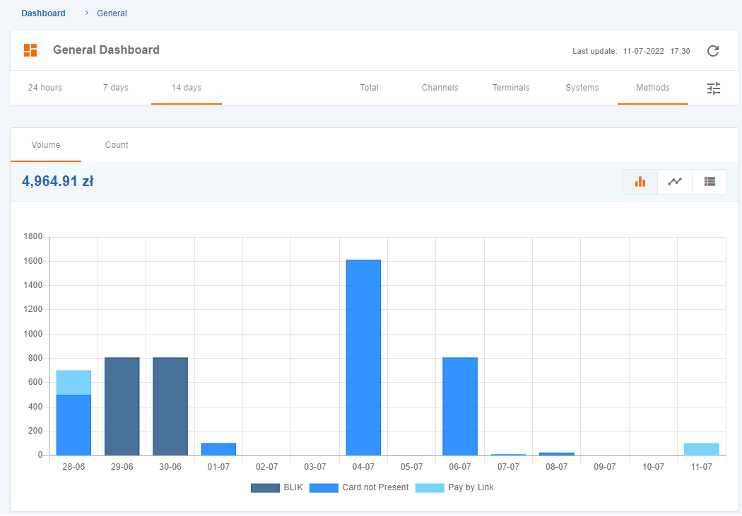
The Methods are the payment instruments (examples: Cards Pay by Link, BLIK, Paypal, Apple Pay). At most seven different Methods are shown, being that lesser relevant payment methods are aggregated under the “Others” category.
“Totalizers” filter
The ‘Total’ is the sum of all transactions available. By clicking on one of the categories, a table is displayed with the broken-down data.
Graphs
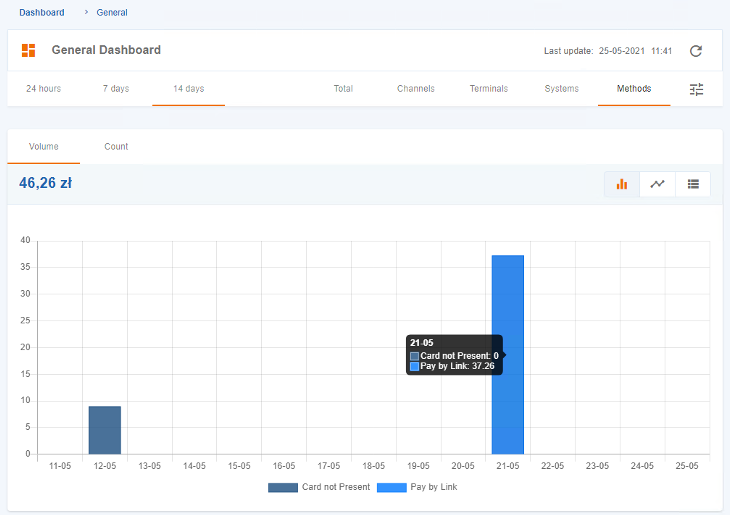
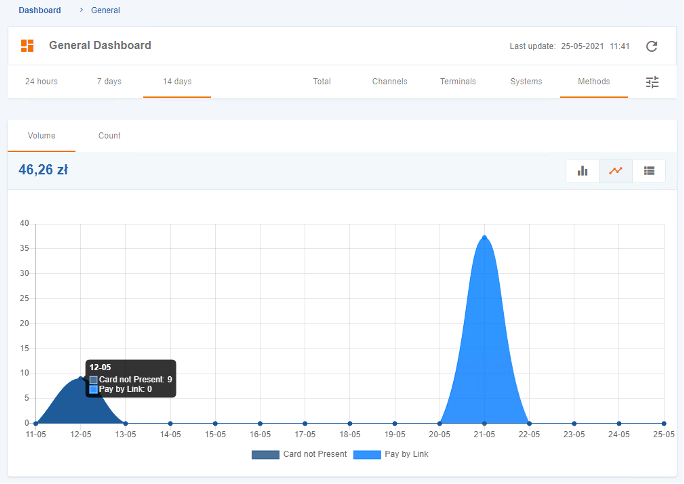
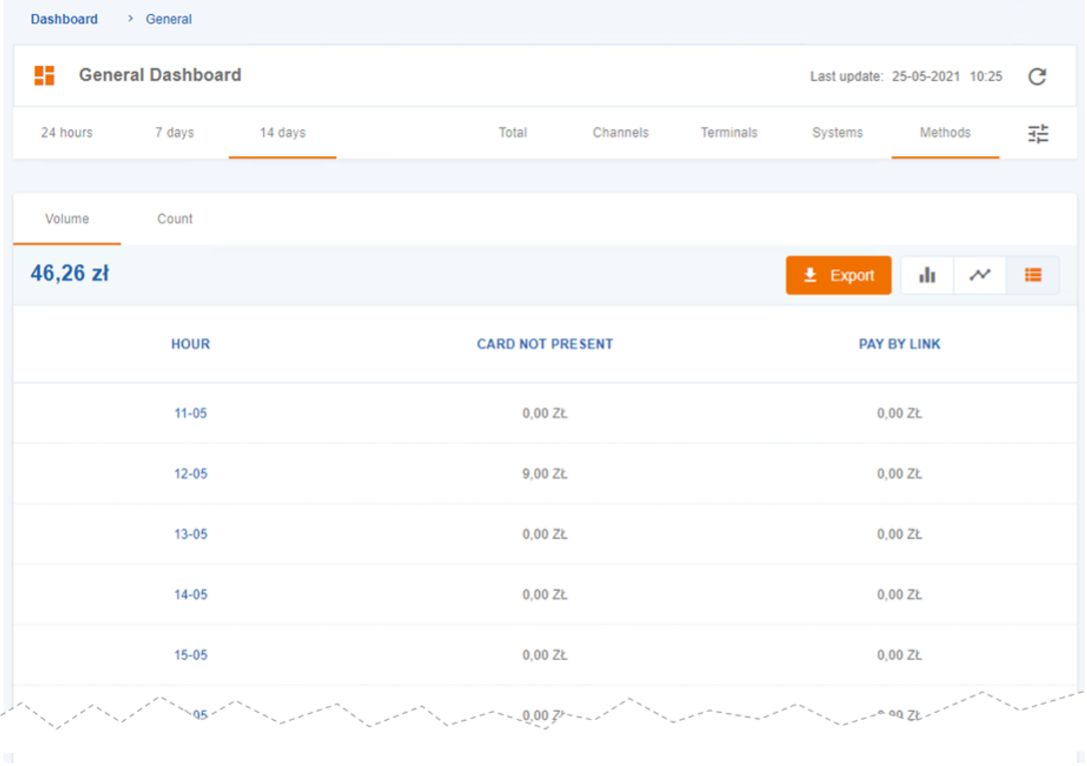
The data of the previously selected category are represented graphically on the Dashboard, under the format of a bar graph, line graph or list.
Bar Graph
The information is presented in the form of bars segmented by colours, which represent the options of the selected category.

Line Graph
A line graph appears for each option of the selected category.

List
The chart information is presented under the form of a table, which can be exported in CSV format.
